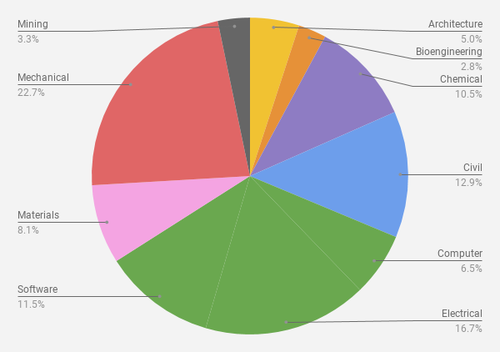
Departmental Statistics
Revision as of 15:06, 29 June 2018 by Malcolmmcc (talk | contribs)
 This contains information for all students enrolled for the 2017-2018 calendar year. Eligible students includes part-time or full-time students, as well as students studying from abroad.
Last updated June 29, 2018
| Department | U0 | U1 | U2 | U3+ | Total |
|---|---|---|---|---|---|
| Architecture | 14 | 49 | 46 | 57 | 166 |
| Bioengineering | 27 | 41 | 26 | 0 | 94 |
| Chemical | 41 | 71 | 74 | 161 | 347 |
| Civil | 59 | 94 | 94 | 179 | 426 |
| Computer | 28 | 55 | 46 | 85 | 214 |
| Electrical | 49 | 85 | 129 | 290 | 553 |
| Other | 6 | 6 | 0 | 0 | 15 |
| Materials | 47 | 52 | 48 | 120 | 267 |
| Mechanical | 74 | 145 | 154 | 375 | 748 |
| Mining | 1 | 9 | 13 | 72 | 95 |
| Software | 38 | 104 | 80 | 157 | 379 |
| Total | 384 | 711 | 710 | 1496 | 3304 |
Other Figures
Part Time Students
161 students are registered part-time, 3083 are full-time, and the remaining 12 are non-resident. Non-residency arises in the case of full-time employment/studying abroad; it essentially acts as a placeholder while pursuing education or work experience elsewhere.
Minors
Currently 401 of the 3256 (12.31%) of undergraduate students in engineering are pursuing a minor degree. The top three most popular minors for engineers are Software Engineering (85), Biomedical Engineering (59), and Construction Engineering & Management (33).